

Analyze results
Once a survey’s results are compiled, Analyze results on the survey page opens the full results view. Owners and managers see everything here; nothing is visible to anyone else until you release access.
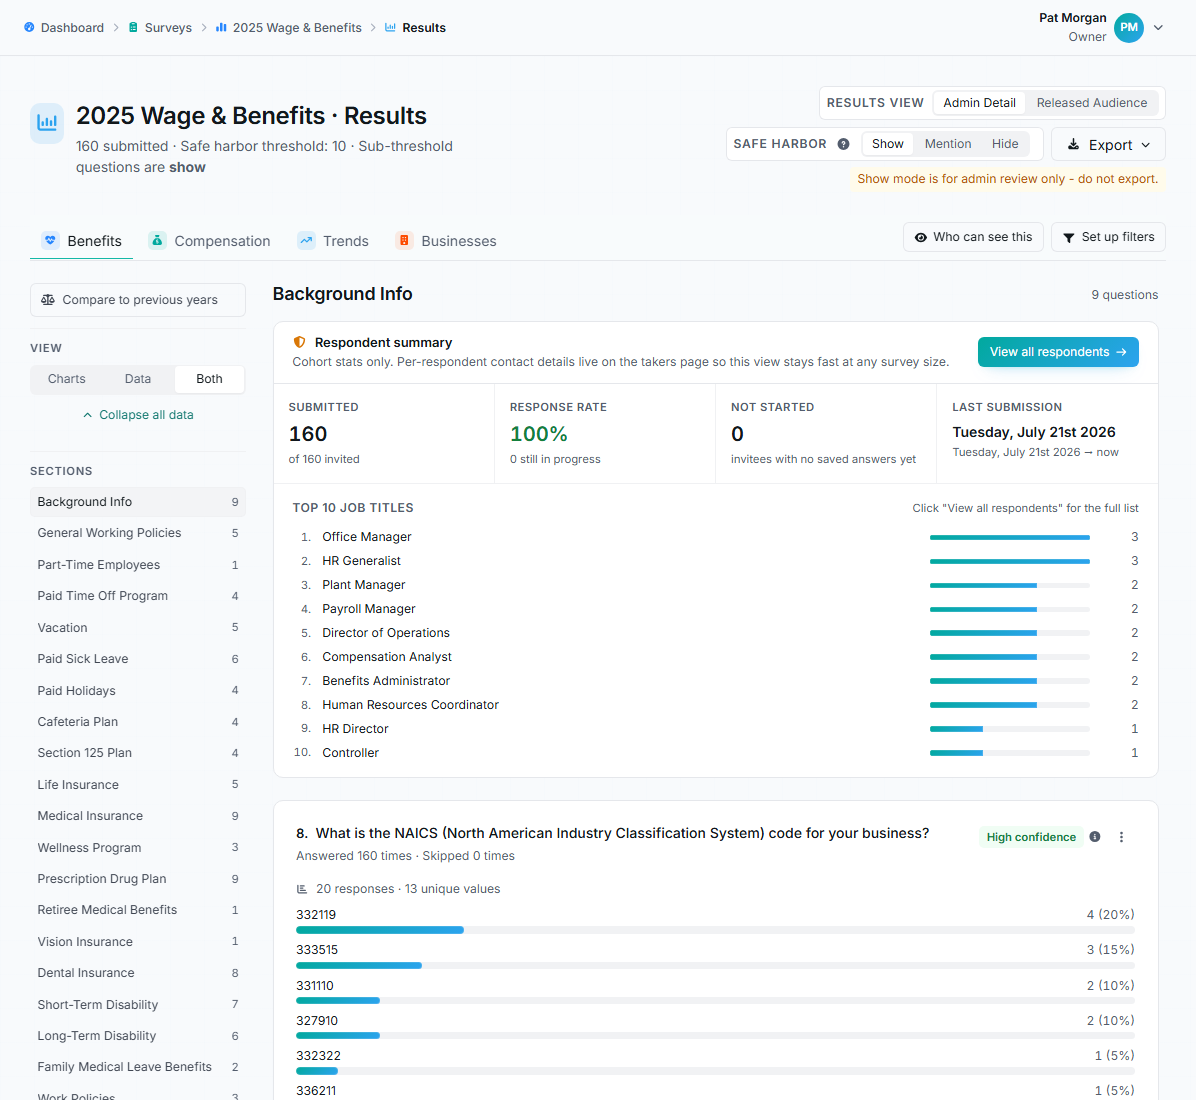
Results page in admin view showing tabs, respondent summary, charts, and confidence badges.
The four tabs
Section titled “The four tabs”- Benefits: every non-compensation question, organized by survey section, with charts and data tables. A respondent summary up top shows submitted count, response rate, and last submission.
- Compensation: aggregated wage data per occupation: ranges, typical values, and any per-role extras the survey collected (fill difficulty, turnover, and so on).
- Trends: year-over-year comparisons, available when the survey is linked to a predecessor. See Trends and linked surveys.
- Businesses: the participation list showing which businesses were invited, their status, progress, and last activity. What released audiences see of this tab is configurable; admin view always shows the full table.
Use the View toggle to switch each question between charts, data tables, or both.
Results view: Admin detail vs. Released audience
Section titled “Results view: Admin detail vs. Released audience”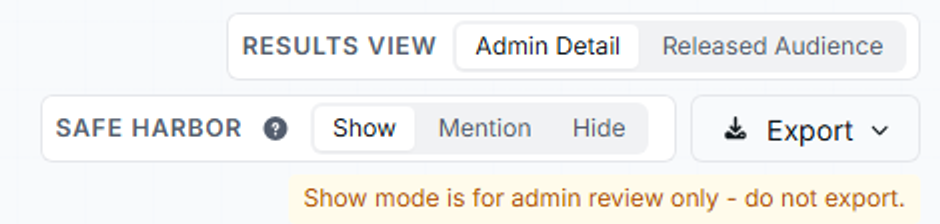
The results header controls: Results view toggle, Safe harbor display switcher, and Export menu.
The header’s Results view toggle is the most important control on the page:
- Admin detail: the full internal view, including data below the safe harbor threshold.
- Released audience: exactly what released viewers, subscribers, and takers will see, with safe harbor suppression, hidden columns, and excluded questions applied for real.
Always check the Released audience view before releasing. In admin view, a Safe harbor switcher (Show / Mention / Hide) additionally controls how sub-threshold questions display while you review; Show mode is for admin eyes only and warns you not to export from it.
Confidence badges
Section titled “Confidence badges”Each question is labeled High confidence (answered at least twice the threshold), Low confidence (above threshold but under twice), or Below threshold. Use these to decide how strongly to lean on a number in your report. See Understand results and safe harbor.
Filters
Section titled “Filters”Set up filters lets you choose which questions become filter axes; choice questions and bucketed number questions qualify. Once axes are enabled, anyone viewing results (including released audiences) can filter, for example, to one organization type or size band.
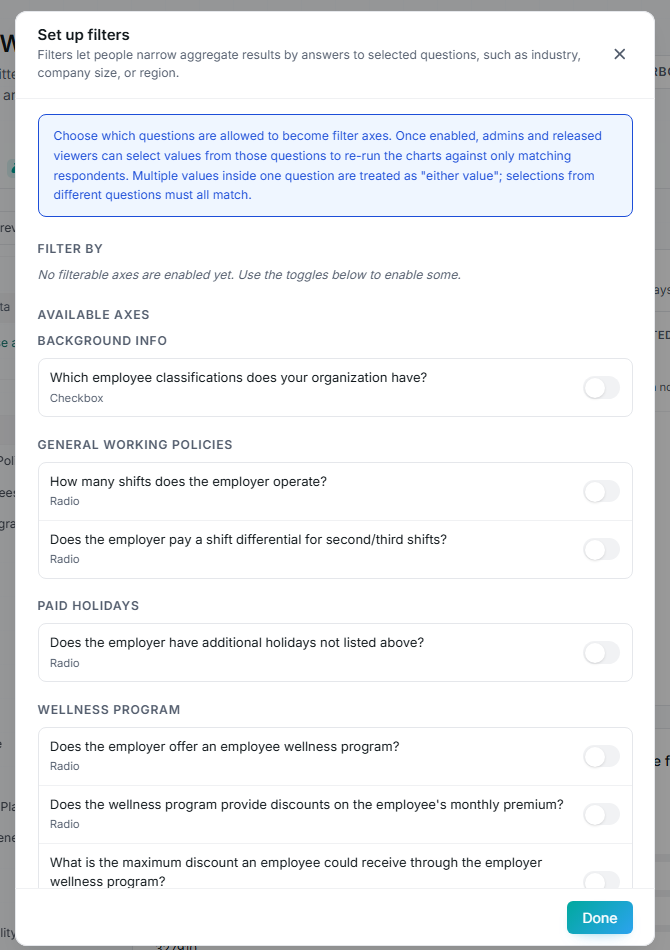
The Set up filters dialog with value pickers and the Available axes toggles.
Filter semantics: multiple values selected within one question are OR (“either of these”); selections across questions are AND (“must match all”). Safe harbor re-applies to every filtered slice, so filters can’t be used to isolate a single business.
Who can see this
Section titled “Who can see this”The Who can see this button opens audience management: releasing, scheduling, revoking, and per-person access. Covered in Release results and Manage who can see results.
Exporting
Section titled “Exporting”The Export menu (admin view only) offers Export CSV…: choose which sections to include, whether to include compensation wage data (one row per occupation, level, and range point), and whether to include free-text verbatims, which are off by default because verbatims can contain identifying information. PDF exports are labeled coming soon.
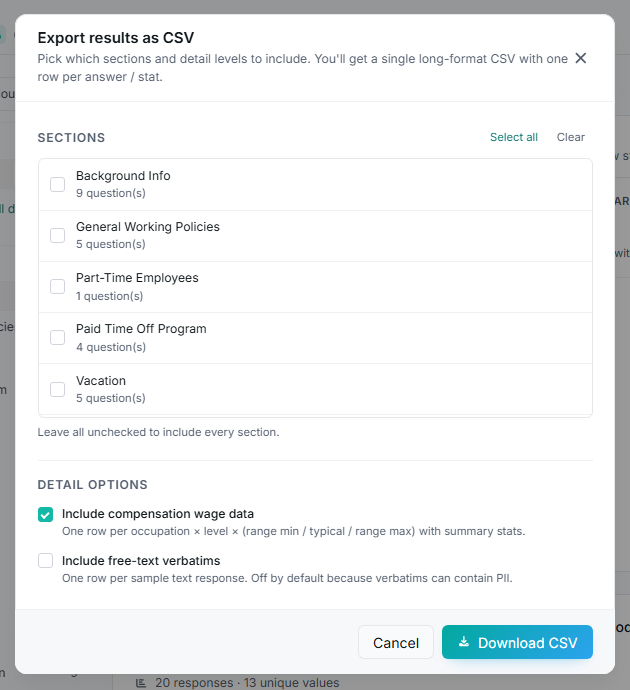
The Export results as CSV dialog with section picker and detail options.
Treat exports with the same care as the live page: an export made in admin view contains data that safe harbor would hide from released audiences.