

Compensation questions
The compensation panel is the question type that makes Sensible Surveys a wage and benefits platform. Takers pick the occupations their business employs, then report wage ranges (and optional details) for each one. Results aggregate this into regional compensation data, protected by safe harbor.
A survey can contain one compensation section. Add it from the editor sidebar with Add compensation survey, use the compensation section that ships with the standard template, or pick the type from the question picker:
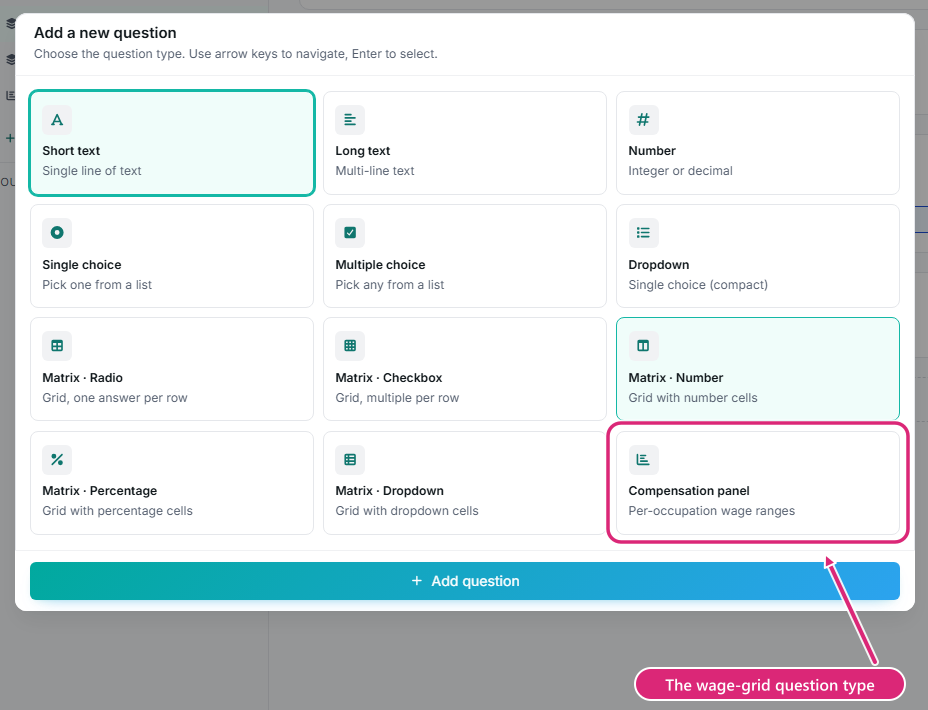
The question type picker with the Compensation panel card highlighted.
What takers experience
Section titled “What takers experience”Takers first choose their occupations from a searchable, categorized list, then fill a wage grid per occupation: a minimum, typical, and maximum wage (per career level if levels are enabled). The compensation part of a survey is answered occupation by occupation, and every selected occupation must be completed before submission.
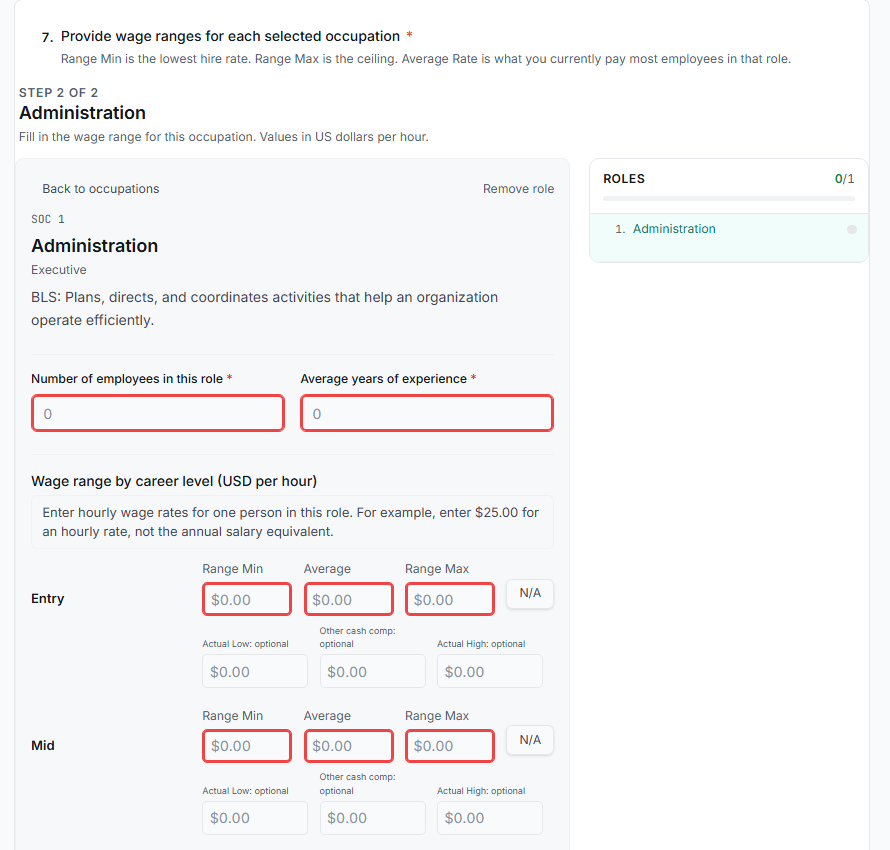
The wage grid a taker fills out for one occupation, with career levels and range fields.
Occupations
Section titled “Occupations”The occupation list is based on standard BLS occupational classifications, grouped by category. In the editor’s Available occupations panel you control what takers can pick:
- Default: all occupations are available. Fine for broad surveys.
- Restrict to a selection: check only the occupations relevant to your region or industry. A counter banner confirms “Restricted to N occupation(s)”.
- Don’t leave the selection empty in restricted mode; a red “No occupations available” warning means takers would have nothing to report.
Custom roles
Section titled “Custom roles”If a local role isn’t in the standard list, use Add custom roles to define it (title, category, description), individually or by CSV upload with Title, Category, and Description columns.
Career levels
Section titled “Career levels”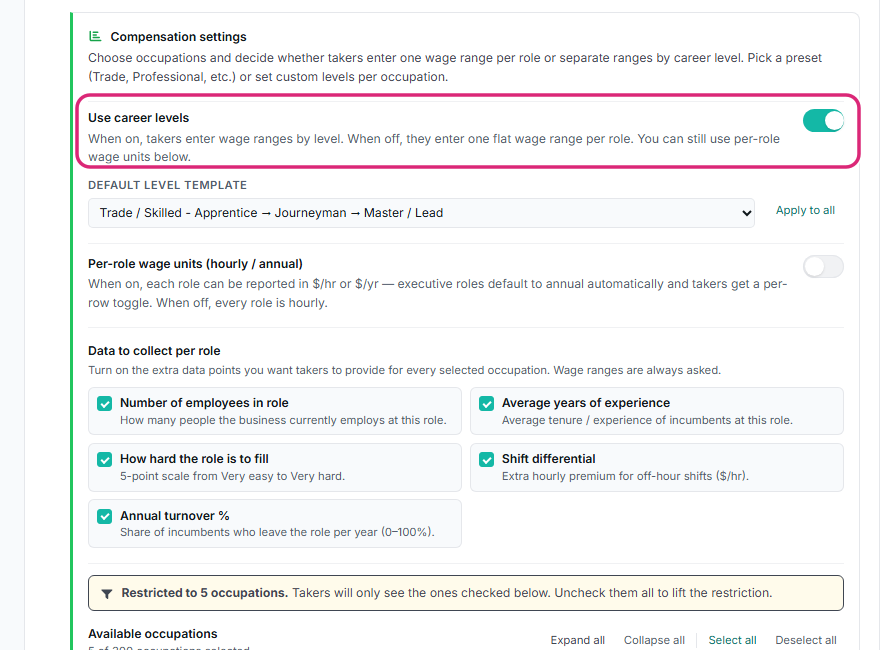
Compensation settings in the editor with the Use career levels toggle highlighted.
Turn on Use career levels to collect wages per experience level instead of one range per occupation. Choose a default level template (for example Entry → Mid → Senior → Lead/Principal for professional roles, Apprentice → Journeyman → Master/Lead for trades, or Supervisor → Manager → Director for management) and apply it to all occupations, or override individual occupations with a different template or fully custom level names.
Hourly vs. annual wages
Section titled “Hourly vs. annual wages”With Per-role wage units enabled, each occupation reports in the unit that fits it: Hourly ($/hr) or Annual ($/yr). Set the default unit, and note that management and executive occupations sensibly default to annual. Takers see the unit clearly in the wage grid.
Data to collect per role
Section titled “Data to collect per role”Wage ranges are always collected. Optionally add, per occupation:
- Number of employees in role
- Average years of experience
- How hard the role is to fill (five-point scale, Very easy → Very hard)
- Shift differential
- Annual turnover %
Each extra field costs taker effort, so pick the ones your report actually needs.
Compensation in results
Section titled “Compensation in results”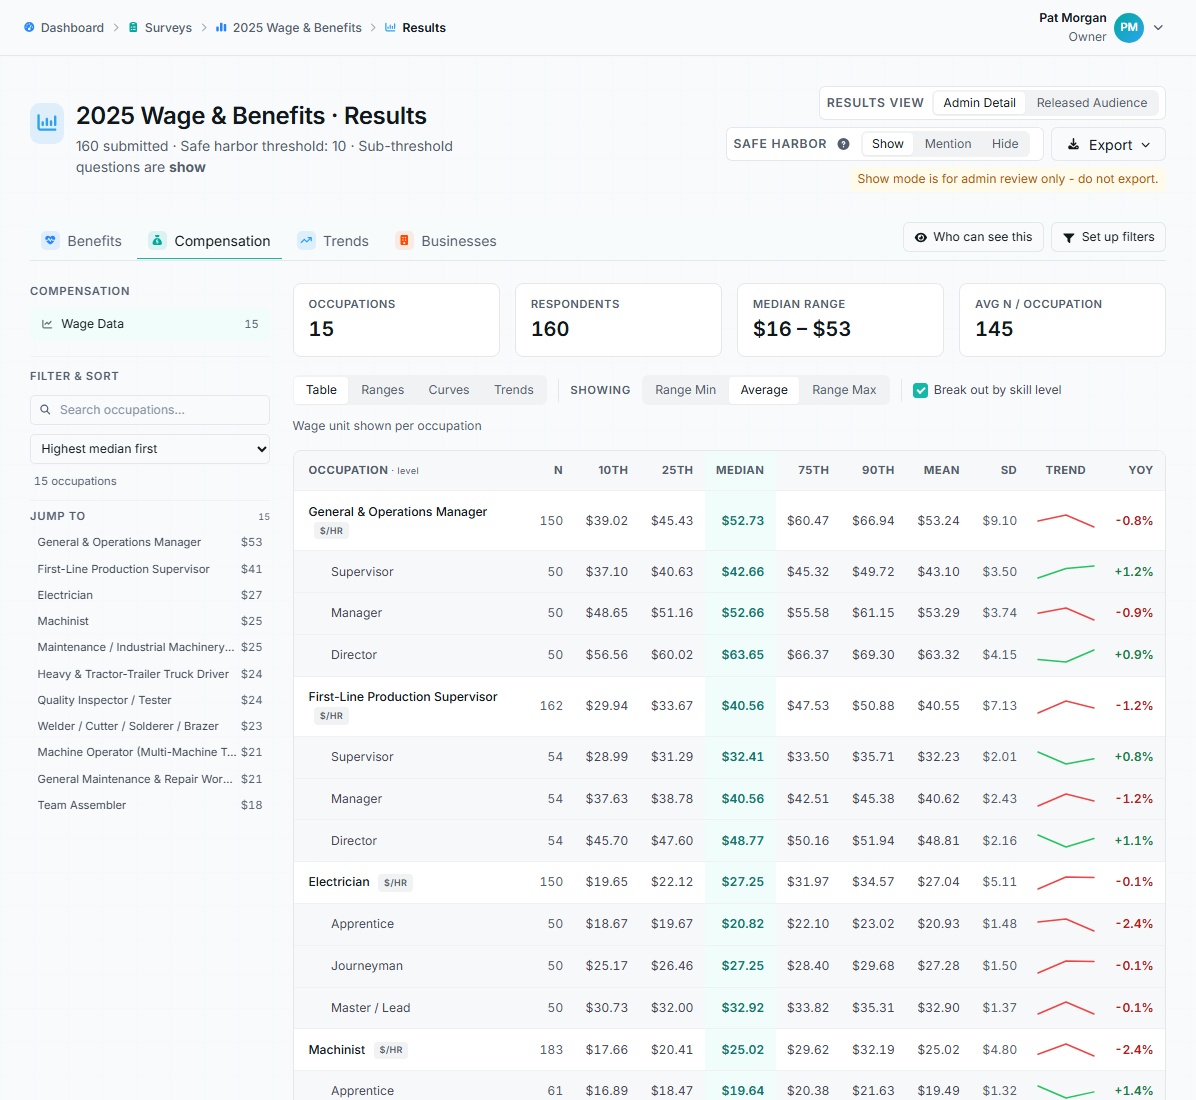
The Compensation results tab with aggregated wage data per occupation and career level.
The results page has a dedicated Compensation tab showing aggregated wage ranges per occupation. Safe harbor applies per occupation: an occupation reported by fewer businesses than the survey’s threshold shows no wage data to released audiences, no matter how many wage entries those few businesses submitted. See Understand results and safe harbor.
- Restrict the occupation list to what your region genuinely employs; takers give up when scrolling irrelevant occupations.
- Only enable career levels if your audience can genuinely distinguish them; otherwise a single range per occupation gets better data.
- Link the survey to last year’s edition so returning businesses see their previous compensation entries pre-filled; it dramatically reduces effort. See Trends and linked surveys.